Can you bake the radish pie?
By Benjamin Soltoff in R
September 17, 2021
Today’s Riddler Express was an interesting application of sequences and convergence:1
I recently came across a rather peculiar recipe for something called Babylonian radish pie. Intrigued, I began to follow the directions, which said I could start with any number of cups of flour.
Any number? I mean, I had to start with some flour, so zero cups wasn’t an option. But according to the recipe, any positive value was fair game. Next, I needed a second amount of flour that was 3 divided by my original number. For example, if I had started with two cups of flour, then the recipe told me I now needed 3 divided by 2, or 1.5, cups at this point.
I was then instructed to combine these amounts of flour and discard half. Apparently, this was my new starting amount of flour. I was to repeat the process, combining this amount with 3 divided by it and then discarding half.
The recipe told me to keep doing this, over and over. Eventually, I’d have the proper number of cups of flour for my radish pie.
How many cups of flour does the recipe ultimately call for?
Let’s get the math out of the way first. This appears to express a converging sequence. Regardless of the initial value, the sequence will eventually converge to a stable estimate of the flour needed for the recipe.
The author’s reference to a “Babylonian radish pie” piqued my curiousity. And as soon as I typed in “Babylonian” into Google search, I was led to the
Babylonian square root algorithm, one of the first known algorithms for approximating the square root of a value. A simplified form of the problem is suppose you are given any positive number \(S\). To find the square root of \(S\):
- Make an initial guess of a positive number
\(x_0\). - Apply the formula
\(x_1 = \frac{x_o + S}{2}\).\(x_1\)is a better approximation of\(\sqrt{S}\). - Iterate on step 2 until the process converges to a stable estimate.
Based on the prompt, we’re applying this method to approximate the square root for
\begin{aligned} S &= 3 \\ \sqrt{S} &\approx 1.7321 \end{aligned}
Full disclosure: I knew it was a sequence, but didn’t bother thinking of it mathematically until after I solved it computationally. So I might as well showcase that work here, as it also forced me to remember how to use while() loops in functions.
library(tidyverse)
library(gganimate)

theme_set(theme_minimal(base_size = 18))
First I need a function to apply the algorithm for any given initial guess.
flour_start <- function(step_1) {
  # divide 3 by starting amount
  step_2 <- 3 / step_1

  # combine starting amount with x, discard half
  step_3 <- (step_1 + step_2) / 2

  return(step_3)
}
Next I want to apply this function for any initial estimate, applying it to each successive estimate until I converge to a stable estimate (as defined by the tolerance threshold):
# generate sequence of measurements
flour_needed <- function(initial_guess, tolerance = 0.001){
  # placeholder for measurements
  flour_seq <- vector(mode = "numeric")

  # continue measuring flour until quantity does not change
  i <- 1
  converged <- FALSE
  flour_seq[[i]] <- initial_guess

  while(!converged) {
    # increment i
    i <- i + 1

    # calculate next amount of flour
    flour_seq[[i]] <- flour_start(step_1 = flour_seq[[i - 1]])

    # if new amount is same as original amount, stop
    if(abs(flour_seq[[i]] - flour_seq[[i - 1]]) < tolerance) {
      converged <- TRUE
    }
  }

  # return the sequence
  return(flour_seq)
}
At this point, I can apply it to a bunch of random starting guesses. They just need to be positive values, so I generated them from a uniform distribution between 0 and 100.
# test the function with random positive values
set.seed(123)
flour_trials <- tibble(
  initial_flour = runif(n = 1e03, min = 0, max = 100)
) %>%
  mutate(.id = row_number(),
         flour_seq = map(.x = initial_flour, .f = flour_needed)) %>%
  # restructure for tidy analysis
  unnest(cols = flour_seq) %>%
  group_by(.id) %>%
  mutate(n_id = row_number()) %>%
  ungroup()
How does it perform?
# animate the measurements
ggplot(data = flour_trials, mapping = aes(x = n_id, y = flour_seq, group = .id)) +
  geom_line(alpha = .02) +
  labs(title = "Baking a radish pie",
       x = "Iteration",
       y = "Amount of flour required",
       caption = "Each line is a separate simulation") +
  transition_reveal(along = n_id)
# how quick to converge?
flour_trials %>%
  group_by(.id) %>%
  summarize(iter = max(n_id)) %>%
  count(iter) %>%
  mutate(n_pct = n / sum(n)) %>%
  ggplot(mapping = aes(x = iter, y = n_pct)) +
  geom_col() +
  scale_y_continuous(labels = scales::percent) +
  labs(title = "Baking a radish pie",
       x = "Number of iterations until convergence",
       y = NULL)
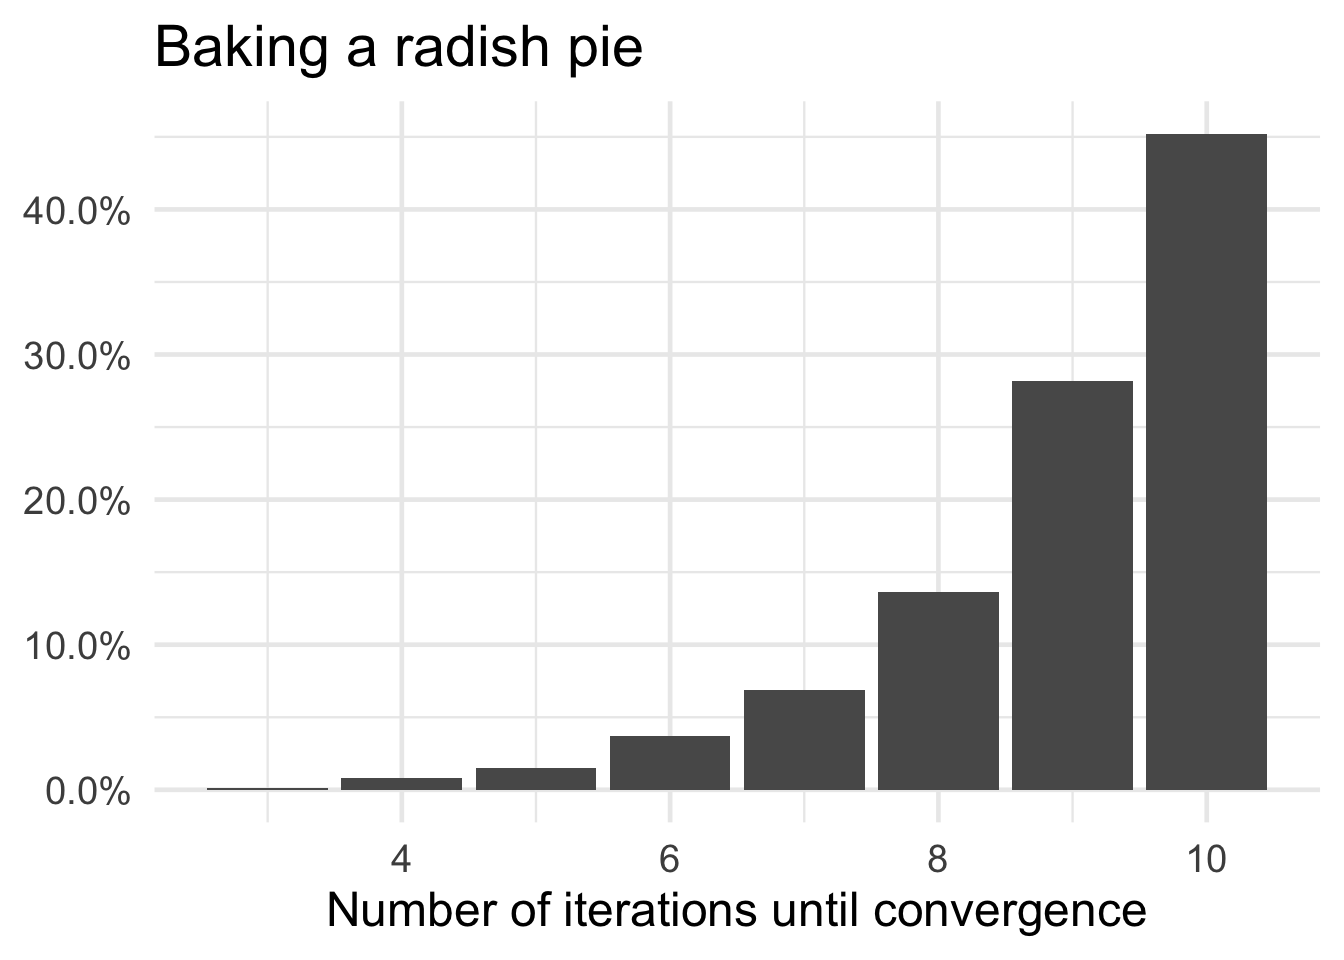
All the trials converged to the same estimate of 1.7321 give or take three decimal places.
-
Fresh on my mind from a math camp I’ve been teaching the past three weeks. ↩︎